![]() VB
.NET
- Exibindo dados em um Gráfico (revisão)
VB
.NET
- Exibindo dados em um Gráfico (revisão)

|
|
|
 |
Neste artigo vamos recordar como exibir dados em um gráfico usando a linguagem Visual Basic .NET e o controle Chart. |
 |
Já faz muito tempo que a Microsoft Liberou o .NET Chart Control , oriundo do Dundas Charts, como um add-on gratuito para a plataforma .NET, oferecendo dessa forma um recurso com possibilidades muitos interessantes para a geração de gráficos tanto com ASP .NET como com aplicações Windows Forms, uma área muito carente na plataforma .NET.
Neste link você encontra exemplos e documentação sobre o componente: http://code.msdn.microsoft.com/mschart
Este artigo é uma revisão de conceitos de como apresentar dados que estão em uma tabela em um gráfico usando o controle Chart.
No exemplo teremos um banco de dados Microsoft Access Controle.accdb e duas tabelas : Vendas e Despesas :
 |
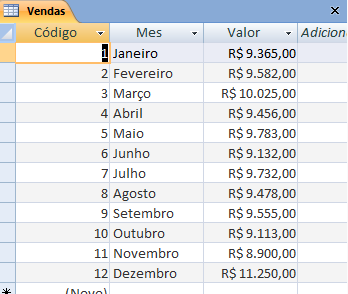 |
| Despesas | Vendas |
Vamos então acessar os dados exibindo-os em um gráfico.
Recursos usados:
Nota: Baixe e use a versão Community 2015 do VS ela é grátis e é equivalente a versão Professional.
Criando o projeto no VS Community
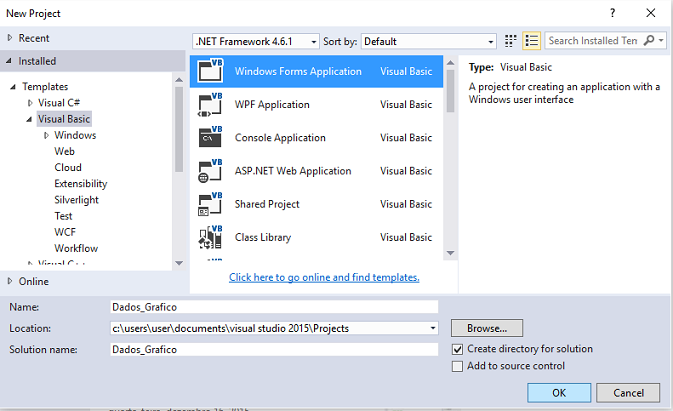
Abra o VS Community 2015 e clique em New Project;
Selecione a linguagem Visual Basic e o template Windows Forms Application;
Informe o nome Dados_Grafico e clique no botão OK;
A partir da ToolBox inclua no formulário os seguintes controles:
Disponha os controles conforme o leiaute da figura abaixo:
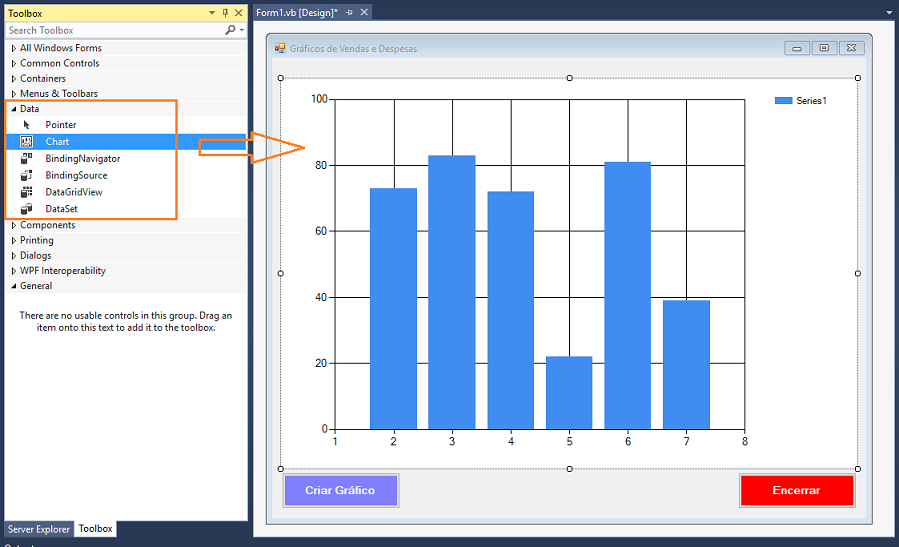
Por padrão o componente Chart apresenta a coleção Series chamada Series1.
Vamos alterar essa configuração padrão removendo a série Series1.
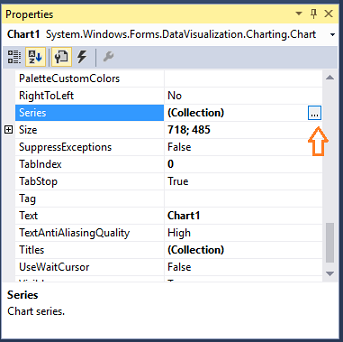
Selecione o controle Chart e na janela de propriedades clicando na propriedade Series:
We will delete Series1 becuase we will replace it with Expenses and Sales.
Right click the chart and click on properties. In the properties window, scroll down to Series and click on the small button next to Collection:
- See more at: http://www.visual-basic-tutorials.com/display-data-as-charts-and-graph-in-visual-basic.html#sthash.lBTOTLaR.dpufWe will delete Series1 becuase we will replace it with Expenses and Sales.
Right click the chart and click on properties. In the properties window, scroll down to Series and click on the small button next to Collection:
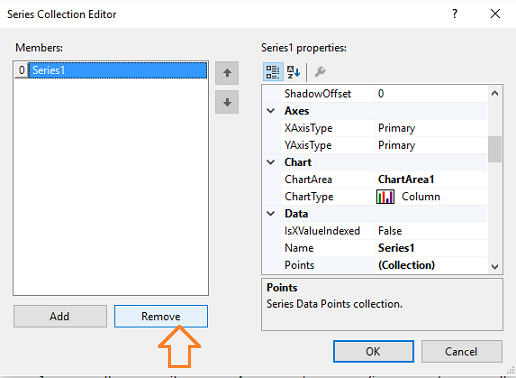
- See more at: http://www.visual-basic-tutorials.com/display-data-as-charts-and-graph-in-visual-basic.html#sthash.lBTOTLaR.dpufSerá exibida a janela Series Collection Editor :
 |
We will delete Series1 becuase we will replace it with Expenses and Sales.
Right click the chart and click on properties. In the properties window, scroll down to Series and click on the small button next to Collection:
- See more at: http://www.visual-basic-tutorials.com/display-data-as-charts-and-graph-in-visual-basic.html#sthash.lBTOTLaR.dpufWe will delete Series1 becuase we will replace it with Expenses and Sales.
Right click the chart and click on properties. In the properties window, scroll down to Series and click on the small button next to Collection:
- See more at: http://www.visual-basic-tutorials.com/display-data-as-charts-and-graph-in-visual-basic.html#sthash.lBTOTLaR.dpufSelecione a serie Series1 e clique no botão Remove.
Vamos incluir duas séries em nosso gráfico: Vendas e Despesas. E vamos fazer isso via código.
No evento Click do botão Criar Gráfico inclua o código para incluir essas duas séries :
Chart1.Series.Add(
"Despesas")A seguir vamos definir o código que acessa o banco de dados Controle.accdb, acessa as duas tabelas : Despesas e Vendas e exibe os dados no gráfico.
Para fazer isso vamos incluir no formulário a declaração do namespace : Imports System.Data.Oledb
O código completo é dado a seguir:
Imports System.Data.OleDb
Public Class Form1
    Private Sub btnCriarGrafico_Click(sender As Object, e As EventArgs) Handles btnCriarGrafico.Click
        'inclua as séries Despesas e Vendas no gráfico
        Chart1.Series.Add("Despesas")
        Chart1.Series.Add("Vendas")
        'define a conexão
        Dim Conn As OleDbConnection = New OleDbConnection
        'define o provedor
        Dim provider = "Provider=Microsoft.ACE.OLEDB.12.0;Data Source ="
        'define o local e nome do arquivo
        Dim dados = "C:\Dados\Controle.accdb"
        'define a string de conexão
        Conn.ConnectionString = provider & dados
        'abre a conexao
        Conn.Open()
        'seleciona os dados das Despesas e atribui à serie
        Dim cmd As OleDbCommand = New OleDbCommand("SELECT Mes, Valor FROM Despesas", Conn)
        Dim dr As OleDbDataReader = cmd.ExecuteReader
        While dr.Read
            Chart1.Series("Despesas").Points.AddXY(dr("Mes").ToString, dr("Valor").ToString)
        End While
        'fecha e libera o datareader e command
        dr.Close()
        cmd.Dispose()
        'seleciona os dados das Despesas e atribui à serie
        cmd = New OleDbCommand("SELECT Mes, Valor FROM Vendas", Conn)
        dr = cmd.ExecuteReader
        While dr.Read
            Chart1.Series("Vendas").Points.AddXY(dr("Mes").ToString, dr("Valor").ToString)
        End While
    End Sub
End Class
|
Nota: O código para acesso a dados esta no formulário por questão de simplicidade pois o objetivo é mostrar a criação do gráfico. O correto é separar as responsabilidades e criar uma classe ou camada de acesso a dados separando o código da camada de apresentação.
Como o código esta todo comentado não há nada mais a dizer.
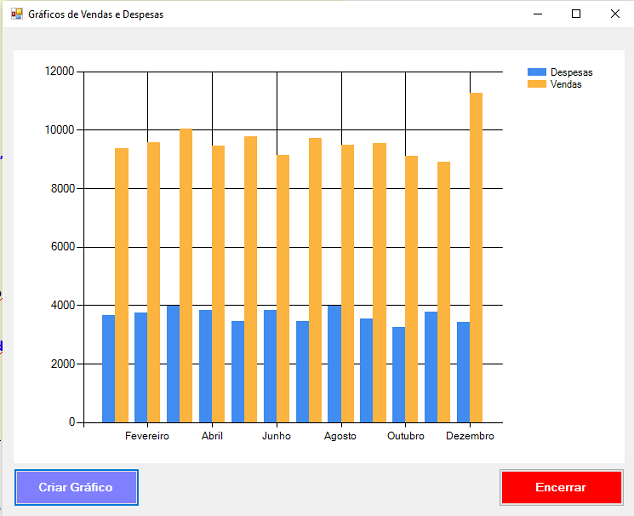
Executando o projeto e clicando no botão para criar o gráfico iremos obter:
Pegue o
projeto completo aqui :
![]() Dados_Grafico.zip
Dados_Grafico.zip
E disse-lhe Jesus: Eu vim a este mundo
para juízo, a fim de que os que não vêem vejam, e os que vêem sejam cegos.
João 9:39
|
Veja os
Destaques e novidades do SUPER DVD Visual Basic (sempre atualizado) : clique
e confira !
Quer migrar para o VB .NET ?
Quer aprender C# ??
Quer aprender os conceitos da Programação Orientada a objetos ? Quer aprender o gerar relatórios com o ReportViewer no VS 2013 ? Quer aprender a criar aplicações Web Dinâmicas usando a ASP .NET MVC 5 ? |
Gostou ? ![]() Compartilhe no Facebook
Compartilhe no Facebook
![]() Compartilhe no Twitter
Compartilhe no Twitter
Referências: