 |
Neste artigo vou mostrar como podemos criar múltiplos gráficos em uma página ASP .NET Web Forms usando a linguagem C# e o componente Chart. |
 |
Já faz tempo que eu escrevi um artigo sobre como usar o componente Chart para criar gráficos em uma aplicação ASP .NET. Veja o artigo aqui - ASP .NET - Usando o controle Chart Control.
Hoje vou mostrar como podemos criar mais de um gráfico em uma página ASP .NET.
Como exemplo eu vou usar o banco de dados Northwind.mdf e criar algumas consultas na forma de procedimentos armazenados para depois criar gráficos com base nessas consultas.
Abaixo o script SQL para criar as consultas que iremos usar na criação dos gráficos:
USE [Northwind]
GO
/****** Object:  StoredProcedure [dbo].[PROC_MULTIPLOS_GRAFICOS]    Script Date: 02/02/2011 19:07:07 ******/
SET ANSI_NULLS ON
GO
SET QUOTED_IDENTIFIER ON
GO
CREATE PROCEDURE [dbo].[PROC_MULTIPLOS_GRAFICOS]
AS
BEGIN
	SET NOCOUNT ON;
select ProductName, UnitPrice from dbo.Products where SupplierID = 12 //--> columa
select ShipCountry, COUNT(1) orders from dbo.Orders group by ShipCountry //--> linha
	select FirstName+' '+LastName 'Employee', COUNT(1) orders                               //--> pizza
	from dbo.Orders o, dbo.Employees e
	where o.EmployeeID = e.EmployeeID
	group by FirstName,LastName
	select CompanyName 'Company', COUNT(OrderID) orders                                     //--> piramide
	from dbo.Orders o, dbo.Customers c
	where o.CustomerID = c.CustomerID
	group by CompanyName
	having COUNT(OrderID) > 10
	order by 2
END
|
Recursos usados:
SQL Server 2008
Northwind
Nota: Baixe e use a versão Community 2015 do VS ela é grátis e é equivalente a versão Professional.
Criando o Web Site no VS 2015 Community
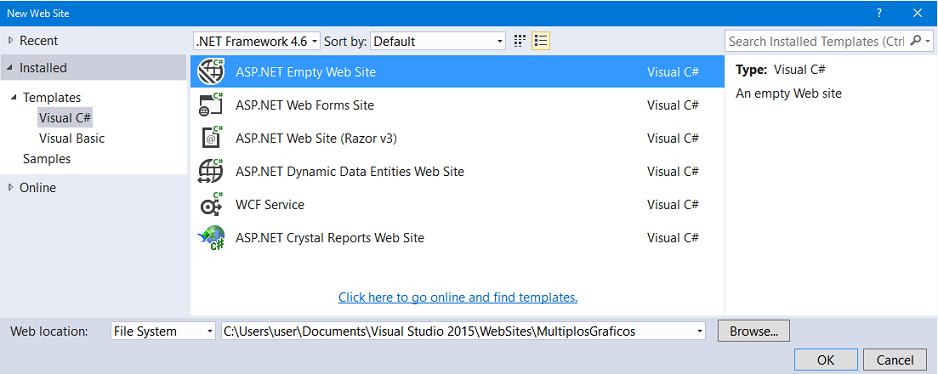
Abra o VS 2015 Community e clique em New WebSite;
Selecione o template Visual C# -> ASP .NET Empty Web Site e informe o nome MultiplosGraficos e clique em OK;
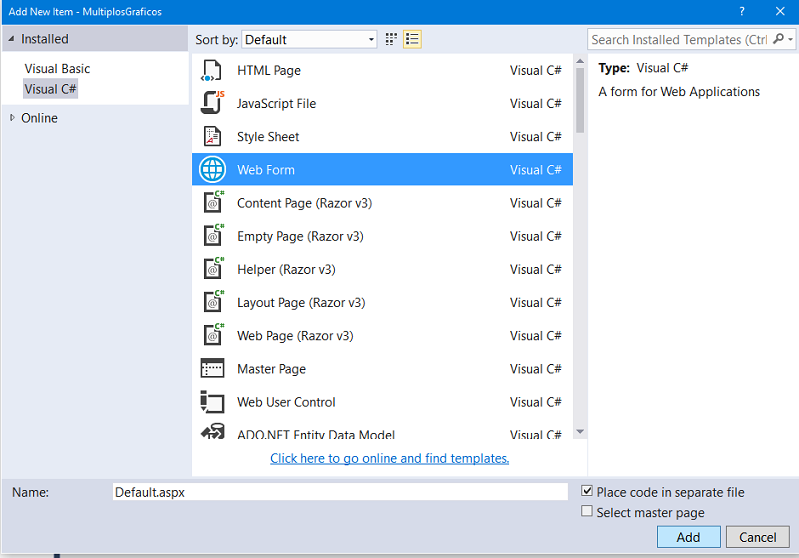
No menu WebSite clique em Add New Item;
Selecione o template Web Form e o nome Default.aspx e clique em Add;
No arquivo Default.aspx no modo Design inclua, a partir da ToolBox, o controle Chart:
<%@ Page Language="C#" AutoEventWireup="true" CodeFile="Default.aspx.cs" Inherits="_Default" %>
<%@ Register Assembly="System.Web.DataVisualization, Version=4.0.0.0, Culture=neutral, PublicKeyToken=31bf3856ad364e35"
 Namespace="System.Web.UI.DataVisualization.Charting" TagPrefix="asp" %>
<!DOCTYPE html>
<html xmlns="http://www.w3.org/1999/xhtml">
<head runat="server">
    <title></title>
</head>
<body>
    <form id="form1" runat="server">
    <div>
        <asp:Chart ID="ChartGraficos" Width="1200px" Height="500px" runat="server" />
    </div>
    </form>
</body>
</html>
|
A seguir vamos definir no arquivo Web.Config a string de conexão com o banco de dados Northwind.mdf :
<?xml version="1.0"?>
<!--
  For more information on how to configure your ASP.NET application, please visit
  http://go.microsoft.com/fwlink/?LinkId=169433
  -->
<configuration>
  <system.web>
    <compilation debug="true" targetFramework="4.6">
      <assemblies>
        <add assembly="System.Web.DataVisualization, Version=4.0.0.0, Culture=neutral, PublicKeyToken=31BF3856AD364E35"/>
      </assemblies>
    </compilation>
    <httpRuntime targetFramework="4.6"/>
  </system.web>
  <connectionStrings>
    <add name="conexaoNorthwind" connectionString="Data Source=.\sqlexpress;Initial Catalog=Northwind;Integrated Security=True" providerName="System.Data.SqlClient"/>
  </connectionStrings>
</configuration>
|
Agora abra o arquivo Default.aspx.cs e inclua o código abaixo neste arquivo:
using System;
using System.Collections.Generic;
using System.Data;
using System.Data.SqlClient;
using System.Drawing;
using System.Web.UI.DataVisualization.Charting;
public partial class _Default : System.Web.UI.Page
{
    protected void Page_Load(object sender, EventArgs e)
    {
        if (!IsPostBack)
        {
            VinculaRegistros();
        }
    }
    void VinculaRegistros()
    {
        ChartGraficos.Legends.Clear();
        ChartGraficos.Series.Clear();
        ChartGraficos.ChartAreas.Clear();
        using (SqlConnection con = new SqlConnection(System.Configuration.ConfigurationManager.ConnectionStrings["conexaoNorthwind"].ToString()))
        {
            using (SqlCommand cmd = new SqlCommand())
            {
                cmd.Connection = con;
                cmd.CommandText = "dbo.PROC_MULTIPLOS_GRAFICOS";
                cmd.CommandType = System.Data.CommandType.StoredProcedure;
                using (SqlDataAdapter sda = new SqlDataAdapter(cmd))
                {
                    using (DataSet ds = new DataSet())
                    {
                        sda.Fill(ds);
                        if (ds.Tables.Count > 0)
                        {
                            List<string> ChartAreaList = new List<string>();
                            ChartAreaList.Add("Products");
                            ChartAreaList.Add("Country");
                            ChartAreaList.Add("Employee");
                            ChartAreaList.Add("Company");
                            int i = 0;
                            String xTitle = "";
                            String yTitle = "";
                            for (i = 0; i < ds.Tables.Count; i++)
                            {
                                if (ds.Tables[i].Rows.Count > 0)
                                {
                                    ChartGraficos.ChartAreas.Add(ChartAreaList[i]);
                                    xTitle = ""; yTitle = "";
                                    ChartGraficos.Series.Add(ChartAreaList[i]);
                                    if (ChartAreaList[i] == "Products") { xTitle = "ProductName"; yTitle = "UnitPrice"; ChartGraficos.Series[ChartAreaList[i]].ChartType = SeriesChartType.Column; }
                                    if (ChartAreaList[i] == "Country") { xTitle = "ShipCountry"; yTitle = "orders"; ChartGraficos.Series[ChartAreaList[i]].ChartType = SeriesChartType.SplineArea; }
                                    if (ChartAreaList[i] == "Employee") { xTitle = "Employee"; yTitle = "orders"; ChartGraficos.Series[ChartAreaList[i]].ChartType = SeriesChartType.Bubble; }
                                    if (ChartAreaList[i] == "Company") { xTitle = "Company"; yTitle = "orders"; ChartGraficos.Series[ChartAreaList[i]].ChartType = SeriesChartType.Range; }
                                    DefineCaracteristicasGrafico(0, ChartGraficos, ChartAreaList[i], xTitle, yTitle);
                                    ChartGraficos.ChartAreas[ChartAreaList[i]].AlignWithChartArea = ChartAreaList[i];
                                    ChartGraficos.Series[ChartAreaList[i]].IsValueShownAsLabel = true;
                                    ChartGraficos.Series[ChartAreaList[i]].Palette = ChartColorPalette.Bright;
                                    ChartGraficos.Series[ChartAreaList[i]].ChartArea = ChartAreaList[i];
                                    ChartGraficos.Series[ChartAreaList[i]]["DrawingStyle"] = "Cylinder";
                                    ChartGraficos.Series[ChartAreaList[i]].Points.DataBindXY(ds.Tables[i].DefaultView, xTitle, ds.Tables[i].DefaultView, yTitle);
                                }
                            }
                        }
                    }
                }
            }
        }
    }
    void DefineCaracteristicasGrafico(int a, Chart tmpChart, String tmpArea, String xTitle, String yTitle)
    {
        if (a == 0)
        {
            tmpChart.BorderSkin.SkinStyle = BorderSkinStyle.Emboss;
            tmpChart.BorderlineColor = System.Drawing.Color.FromArgb(26, 59, 105);
            tmpChart.BorderlineWidth = 2;
            tmpChart.BackColor = Color.Silver;
        }
        if (a == 1)
        {
            tmpChart.ChartAreas[tmpArea].BorderDashStyle = ChartDashStyle.Solid;
            tmpChart.ChartAreas[tmpArea].BorderWidth = 1;
            tmpChart.ChartAreas[tmpArea].BackColor = Color.White;
            tmpChart.ChartAreas[tmpArea].BorderColor = Color.Black;
            tmpChart.ChartAreas[tmpArea].AxisX.Title = xTitle;
            tmpChart.ChartAreas[tmpArea].AxisX.TitleFont = new System.Drawing.Font("Verdana", 10, System.Drawing.FontStyle.Bold);
            tmpChart.ChartAreas[tmpArea].AxisX.Minimum = 0;
            tmpChart.ChartAreas[tmpArea].AxisX.Interval = 1;
            tmpChart.ChartAreas[tmpArea].AxisX.MajorGrid.Enabled = false;
            tmpChart.ChartAreas[tmpArea].AxisY.Title = yTitle;
            tmpChart.ChartAreas[tmpArea].AxisY.TitleFont = new System.Drawing.Font("Verdana", 10, System.Drawing.FontStyle.Bold);
            tmpChart.ChartAreas[tmpArea].AxisY2.LineColor = Color.Black;
            tmpChart.BorderSkin.SkinStyle = BorderSkinStyle.Emboss;
            tmpChart.ChartAreas[tmpArea].AxisX.LabelStyle.Font = new Font("Tahoma", 10, FontStyle.Bold);
            tmpChart.ChartAreas[tmpArea].AxisY.LabelStyle.Font = new Font("Tahoma", 10, FontStyle.Bold);
            tmpChart.ChartAreas[tmpArea].AxisX.MajorGrid.LineColor = Color.FromArgb(64, 64, 64, 64);
            tmpChart.ChartAreas[tmpArea].AxisY.MajorGrid.LineColor = Color.FromArgb(64, 64, 64, 64);
        }
    }
}
|
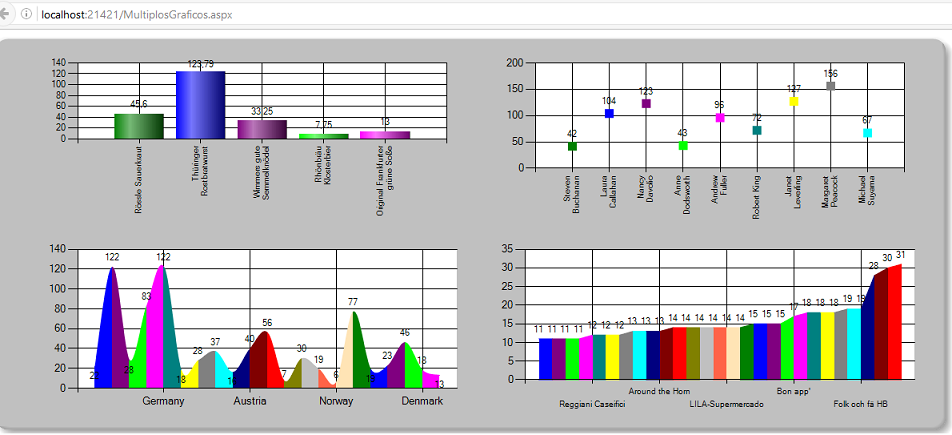
Executando o projeto iremos obter :
Pegue o
projeto completo aqui :
![]() Graficos.zip
Graficos.zip
(Disse Jesus)Este
povo se aproxima de mim com a sua boca e me honra com os seus lábios, mas o seu
coração está longe de mim.
Mas, em vão me adoram, ensinando doutrinas que são preceitos dos homens.
Mateus 15:8,9
|
Veja os
Destaques e novidades do SUPER DVD Visual Basic
(sempre atualizado) : clique e confira !
Quer migrar para o VB .NET ?
Quer aprender C# ??
Quer aprender os conceitos da Programação Orientada a objetos ? Quer aprender o gerar relatórios com o ReportViewer no VS 2013 ? |
Referências:
Super DVD Vídeo Aulas - Vídeo Aula sobre VB .NET, ASP .NET e C#
Super DVD C# - Recursos de aprendizagens e vídeo aulas para C#
Curso Fundamentos da Programação Orientada a
Objetos com VB .NET
![]()
VB .NET - Criando gráficos no VB 2010 Express Edition II - Macoratti.net